Demand 2050 Scenario
To achieve the project's ultimate goal of modelling future low carbon UK grid supply scenarios, firstly a future demand scenario is required. This initial step involves considering all those ongoing and future potential changes in economy, society, policy and technology that might have effects on the future demand.
Needless to say that it is not possible to predict the future demand without uncertainty, but it is possible to model potential scenarios according to known and monitored trends, which might provide us with an idea of how the potential scenarios might look.
We present the 2050 Demand Scenario in Figure 1.
 Figure 1. Scaled comparison of the total demand split in 2014 and the estimated demand sector split scenario for 2050.
An overall demand increase of 32%, from 302 TWh in 2014 to 400 TWh in 2050. Compared to the Future Energy Scenarios presented by Energy Grid, the presented 2050 scenario has a higher demand increase than any of the four scenarios projected by National Grid.
This future scenario estimation assumes that all those policies supporting more efficient uses of electricity, peak demand reductions and a higher penetration of non-fossil fuel appliances and transportation will be implemented.
Estimation Methodology
The starting point for estimating the demand in 2050 was to review the most recent available data on UK's demand and how the electricity consumption is split down into the different consumer sectors has evolved throughout time.
|
Using DUKES (Digest of UK Energy Statistics) UK's demand data was gathered. DUKES Chapter 5 (2015) provided the breakdown between sectors as shown on the right. This gave a starting point for investigating possible future scenarios, and how the different electricity consumption shares might change in the future. |

Figure 2. Electricity demand by sector. DUKES 2015, Chapter 5.
|
Using this data a demand calculation tool was created in Excel. This tool was to help define the inputs to each of the sectors and to finally be able to estimate an overall demand.

Table 1. The table shows the goal of the demand calculator. It aims to compare the 2050 sector split with that of 2014, after the estimated changes in consumption habits have been applied.
Based on a literature review the sectors identified as having the highest contribution to change are Domestic and Transport. No other sectors were considered to change significantly and were left with the same quantitative demand as 2014 demand data.
Domestic Sector
The inputs in the demand calculator which feed into the domestic sector estimation can be seen in Figure 3. These are considered to undergo major changes which result into an increase of the domestic demand by 2050.

Figure 3. Domestic demand inputs
|
The first estimation is that of the number of households. The Office for National Statistics (ONS) data shows trends in population (Fig. 3) and also people per household.
These two factors were projected to 2050 following the same general trend from past data, and together were used to estimate the total number of households in the UK. Considering the number of people per household in 2050 projections (2.14 persons/household), we observe an increase of 38.12% in the number of households compared to 2014. A baseline electricity usage figure was calculated using today's average usage multiplied by the number of households. Secondly, taking into account the world wide decarbonisation targets, low carbon heating technologies will substantially trigger an increase in domestic usage of electricity. The increasing deployment of electric heating and micro-generation in the UK will replace the fossil fueled heating technologies, which represent the major share of domestic demand. This change will be led by green incentives promoting the low carbon technologies. The percentage of homes with electric heating by 2050, which adds additional demand onto the baseline, was taken from the estimations of Future Electricity Scenarios from National Grid. Thirdly, demand reduction factors were also considered. Home and appliances efficiency improvements by 2050 will play a energy saving role in the domestic demand. In the E.U., domestic energy efficiency has improved by 1.8%/year since 2000. Additionally, a demand reduction representing an average figure from demand reduction policies which have proven successful is considered. Demand Response policies enable the consumer to engage with the balancing of the power grid by having an active role in how and when using electricity. Moreover, these demand response policies play a crucial role in moving the grid towards a smart grid configuration. Demand response policies include all those measures that encourage the consumer to shift its electricity consuming behaviour. These range from enhanced consumption information being derived (with smart meters being installed in the consumers' households) to economic incentives in the electricity pricing. Time of use tariffs (TOUT, tariffs differ according to the day time) and Critical Peak Pricing (CPP, reduce critical peak demand. CPP tariffs apply a pre-determined high price during times of exceptionally high demand or 'critical peaks') are currently being implemented in the U.K. (e.g. Economy 7 tariff). After considering all the previous input factors into domestic demand the results saw a 40TWh increase; from 110TWh in 2014, to 150TWh estimated for 2050. |
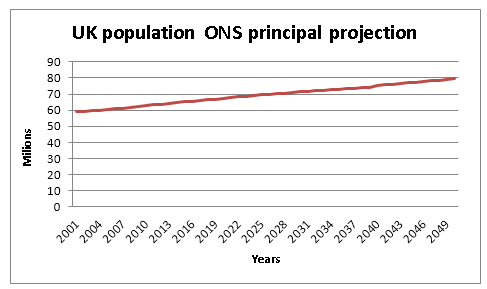
Figure 4. U.K. Population trend based on the Principal Projection of the National Population Projections: 2014-based Statistical Bulletin, 2015, ONS.

Figure 5. Domestic heating annual demand future trends (National Grid, 2015)
Figure 6. Energy Efficiency Rating.

Figure 7. Electricity consumption rates variation information charts, allowing the consumers to make better consumption choices.
|
Transport Sector

Figure 7. Transport demand inputs.
 Figure 8. Global EV sales forecast by geography, 2015-2040. Bloomberg New Energy Finance.
The transport sector electrical demand calculation considered three main inputs: the increase in numbers of cars, the electric vehicles ongoing penetration and the increase in electric train lines.
The estimated number of households from the previous section, along with the ONS data trends of number of cars per household (1.6 cars/household projected for 2050) were used to calculate the estimated total number of cars in the future.
Secondly, the percentage of cars estimated to be electric in 2050 was estimated from the EV sales and manufacturing projections from Plug-in Electric Vehicles manufacturers.
Optimistic scenarios rise up to a 35% of EV in the total share of vehicles sold yearly in 2040 (Bloomberg New Energy Finance scenarios). In Figure 8 a forecast of sales projected for different regions is plotted. The increase in sales of EV is a general trend around the Globe, which translates into a an increase of demand not only in a national scale but at global scale.
An average energy demand per electric car as per present day values was used to calculate total demand for electric cars.
Finally the consumption of electricity due to the increase of electrified trains and an increase of train tracks in the UK is also taken into account.
The historical average increase of electrified train mileage in the U.K. is 1.5%/ year, which would mean a 70.9% increase by 2050 compared to 2014. Nevertheless, the Go Green scenario from Future Energy Scenarios (National Grid) considers a faster progression: up to an increase of 2.5%/year. In our scenario we considered a conservative scenario with a total increase of 50% by 2050 compared to 2014.
The results for transport demand saw a substantial increase; from 3.6TWh in 2014, to 60TWh estimated for 2050.
References:
Anon., 2012. The UK Climate Change Risk Assessment 2012 - Evidence Report , s.l.: Crown copyright 2012.
Bosseboeuf et al., 2015. Energy Efficiency Trends and Policies in the Household and Tertiary Sectors An Analysis Based on the ODYSSEE and MURE Databases. European Union funded project.
David J.C. MacKay (2008), Without the Hot Air; UIT Cambridge.
Department of Energy and Climate Change, 2011. The Carbon Plan.
Department of Energy and Climate Change, 2014. Energy Trend, s.l.: s.n.
Energynet DenmarK, 2014. The EcoGrid Price System in a Demand Response Perspective, Fredericia: Energynet Denmark.
European Comission, 2011. Energy Roadmap 2050 , Brussels: s.n.
Frontier Economics and Sustainability First, 2012. Demand Side Response in the domestic sector, s.l.: Department of Energy and Climate Change.
Harrop and Das, 2016. Electric Vehicle Forecasts, Trends and Opportunities 2016-2026, Hybrid and pure electric vehicles for land, water and air. IDTechEx Research.
Jacobson and Delucchi. 2011. Providing all global energy with wind, water, and solar power, Part I: Technologies, energy resources, quantities and areas of infrastructure, and material. Energy Policy vol. 39. Pages 1154–1169.
National Grid, 2015. Future Energy Scenarios.
Network Rail.
The Solution Project.
